Why the Jersey Shore Is the Northeast's Most Overlooked STR Market

Savvy’s own 2026 rankings name ten short-term rental markets worth buying into, led by Jackson, Mississippi and Abilene, Texas. Our “Best Short-Term Rental Markets to Invest In for 2026” guide doesn’t mention New Jersey a single time.
I don’t think that’s an oversight. I think it’s what happens to a market that’s easy to drive to and hard to underwrite. And in fairness, Savvy didn’t realize what a great market the Jersey Shore was until I started talking their ear off about it. Consider this article the long version of that conversation.
I’m a Jersey Shore native. I sell here, and more relevant to this article, I personally invest and manage short-term rentals here. What follows is a market case built on measured data, including the parts that don’t flatter it.
The demand base nobody has to fly to
That list screens for one thing: cheap entry and strong cap rates. Fair enough. What it can’t screen for is whether you’d ever want to spend a weekend there. For a New York or Philadelphia investor, nearly every market on it is a flight or a long day’s drive, and none of them is a place your family already spends its summers.
The Jersey Shore’s entire thesis is the opposite. It’s the beach for the New York and Philadelphia metros -- two hours by car, or a train on NJ Transit’s Coast Line straight into a string of shore towns. Guests book on a whim because the trip is a drive, not an itinerary, and you can be standing in your own property on a Saturday morning without booking a flight.
If you already own rentals in the Smokies or on the Gulf, you know what that second point is worth -- peace of mind you can’t underwrite. It’s also a real hedge: the two coasts don’t share a hurricane season or an insurance market.
What the numbers actually say
Most agents would show you a peak-season week and call it a day. I’d rather show the annual picture -- the honest view. Across the nine towns with clean municipal-level data (AirROI, trailing twelve months ended 6/30/2026):
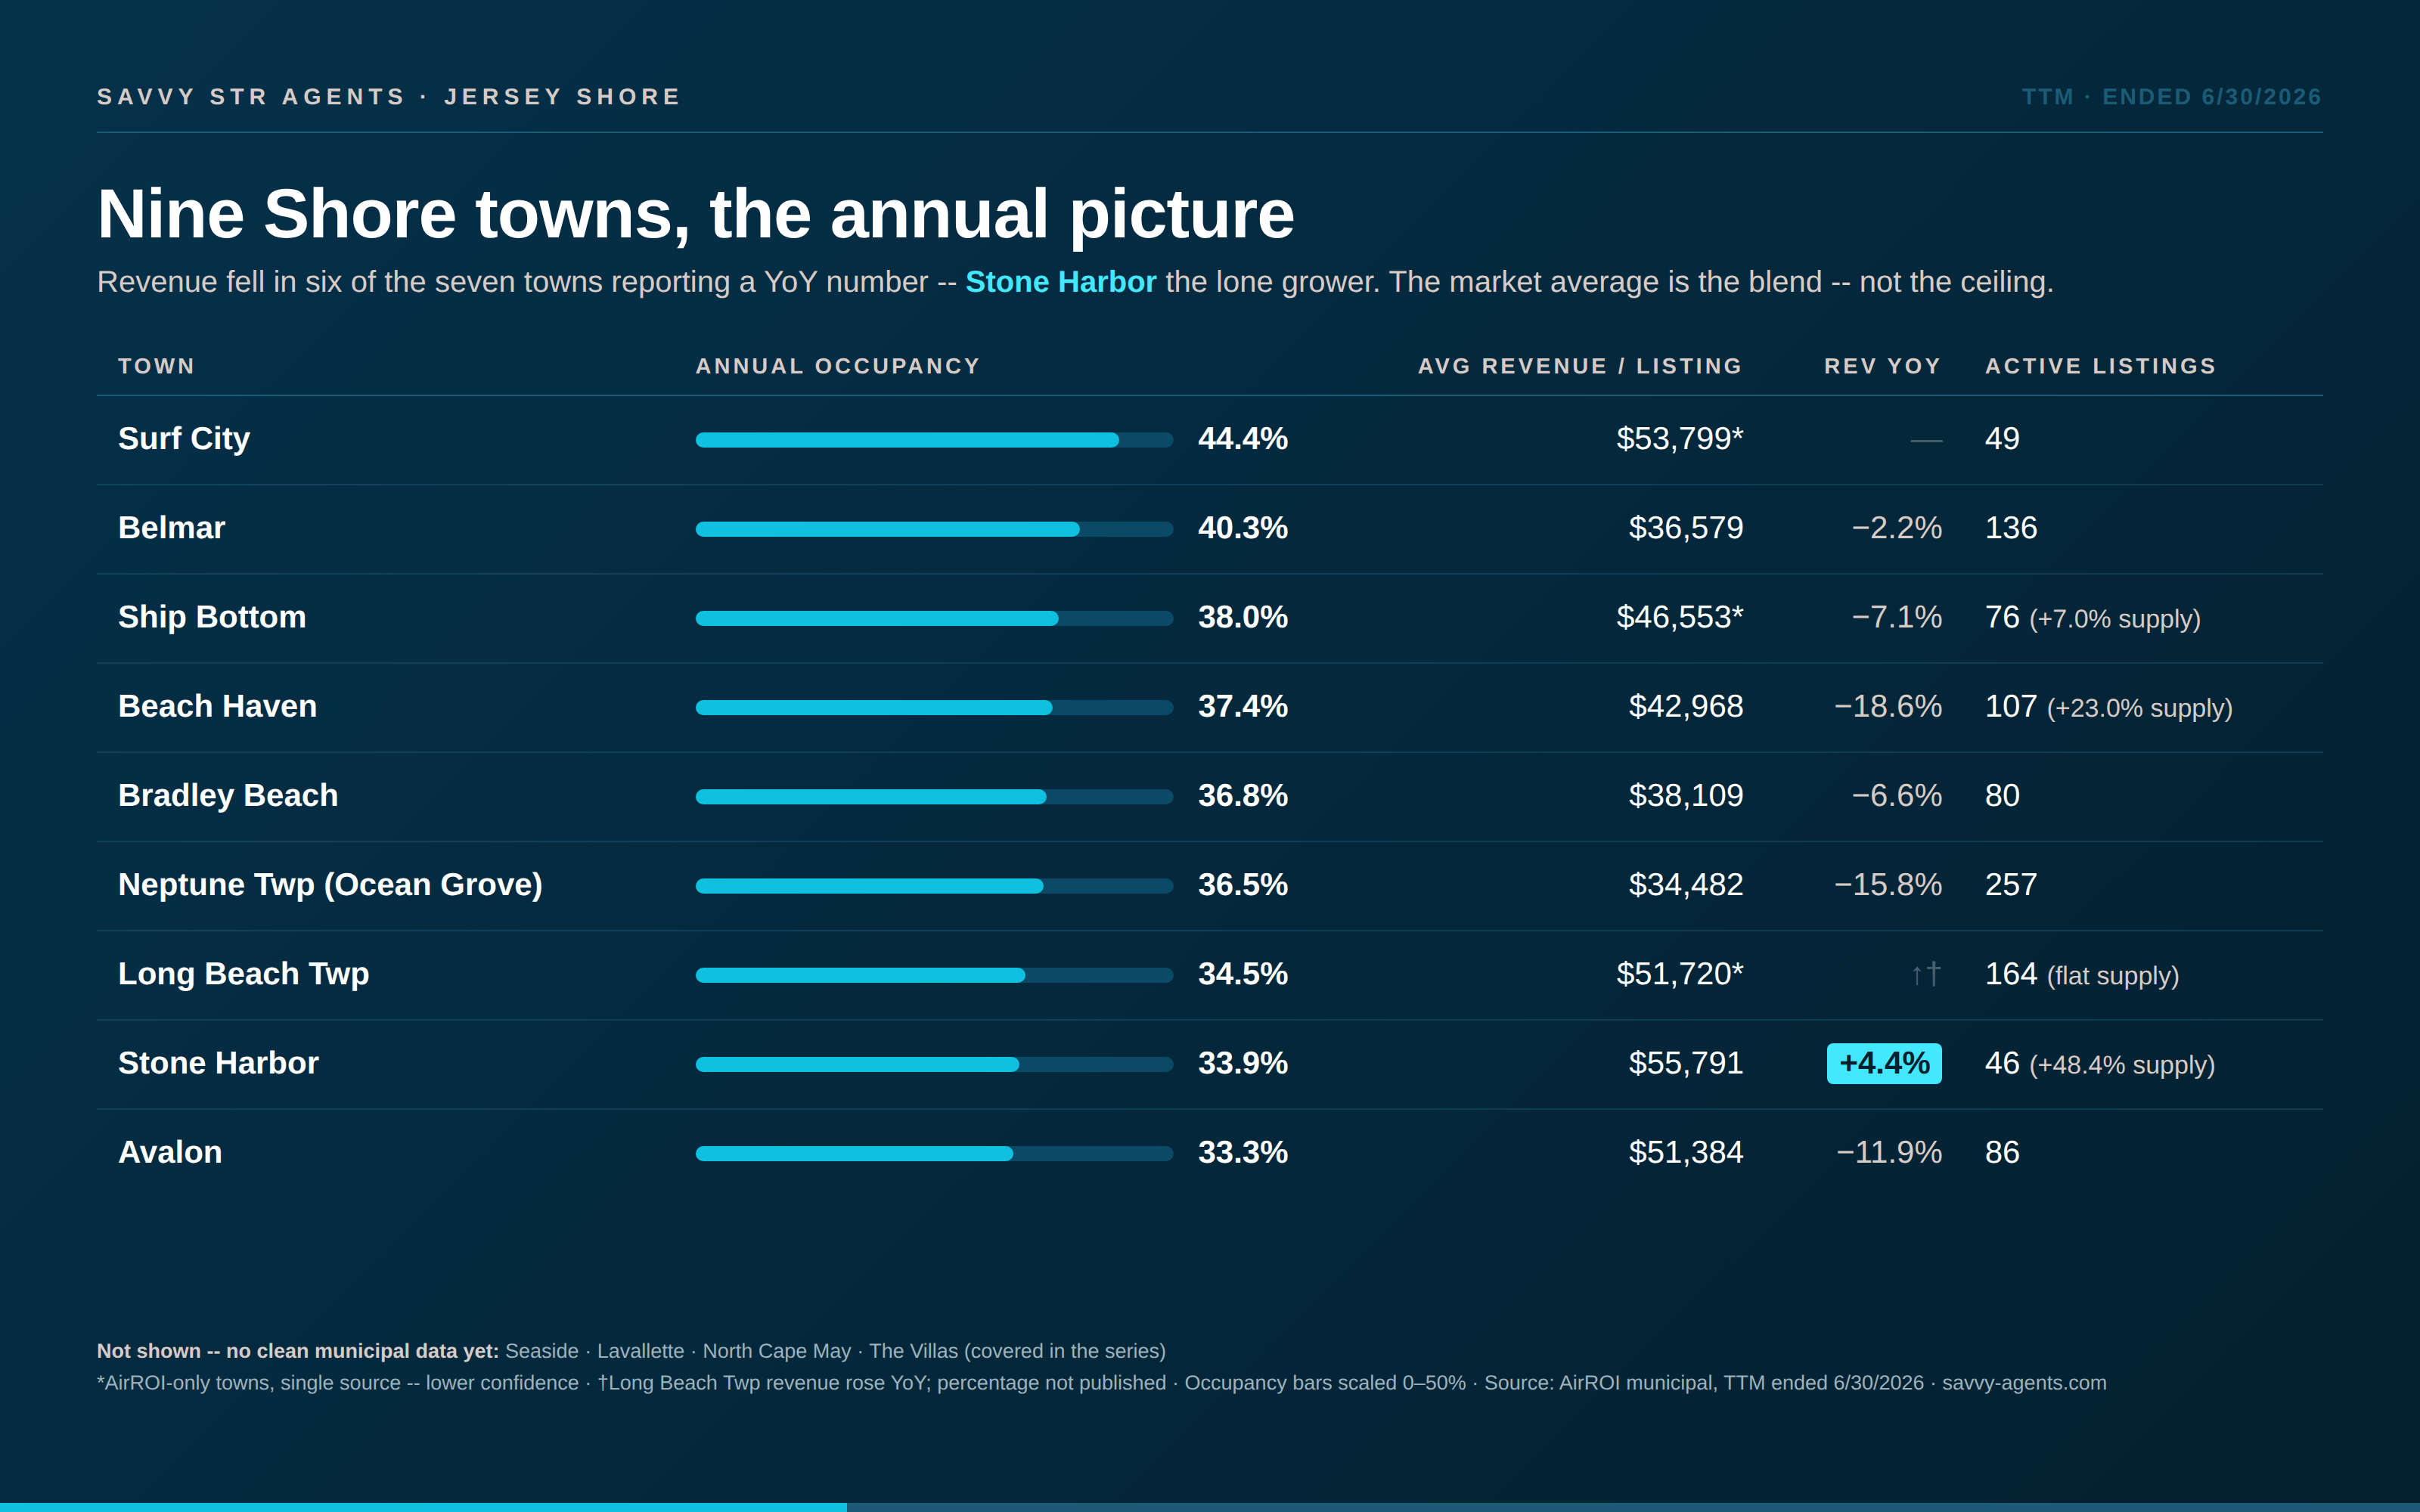
*AirROI-only, single source -- lower confidence. Long Beach Township’s revenue rose YoY (direction published, not percentage). Towns I get into later -- Seaside, Lavallette, North Cape May, the Villas -- have no clean municipal data yet; they’re coming in the series.
Occupancy is low. Thirty-three to forty-four percent, annually -- that’s a compressed season. June through August produces roughly 57% of Beach Haven’s annual revenue; in Stone Harbor it’s closer to 65%. You’re buying a summer business with a long, quiet winter attached, and any pro forma that pretends that’s not a risk is selling you something.
Revenue per listing fell in six of the seven towns that publish a year-over-year number. Stone Harbor was the lone grower in that set, and supply expanded almost everywhere while rates softened.
That is not a pitch, it’s the market. So why am I writing this article?
The 23-point gap that explains the whole market
Because the market average is not the number you’d be operating at, and on the Shore the distance between the two is unusually large.
In Belmar, PriceLabs splits professionally managed listings from self-managed. Pro-managed run 63% occupancy; self-managed run 40%. A twenty-three point spread in the same town, on the same calendar.
That one comparison reframes the whole table: the 40.3% average isn’t a ceiling, it’s a blend of well-run properties and neglected ones -- and the Shore has a lot of the latter. These are legacy family beach houses listed by owners who treat the rental as an afterthought, priced flat all season, with a two-week response time and photos from 2019. A good share of these hosts don’t even provide linens… BYOL.
I don’t have to just take PriceLabs’ word for the pro-managed number. The two-bedroom we run in Belmar finished 2025 at 61% occupancy against that 40% town average, and the 540-square-foot bungalow behind it ran 56%. Those properties earned the gap: I renovated both ahead of where the market was at the time, and they’re priced, answered, and photographed like the business they are. The honest part: if I were starting fresh today, I’d go further than I did then. That’s how competitive this space has become, and it’s exactly the standard to underwrite against when you’re picking your next property, in any market.
The revenue tiers tell the same story. Belmar’s market-wide average is $36,579 per listing, but by bedroom count a 4BR runs about $84,500 and a 5BR about $153,800 (Rabbu, Q2 2026). Underwrite a well-run four-to-five bedroom against that tier, not against a town average dragged down by every under-managed one-bedroom on the block.
The tax line that quietly decides your return
This is the part I most often see missed, and as a CPA it’s the first line I look at. Effective rates are not close to uniform (NJ 2025 Table of Equalized Valuations):
- Avalon: 0.348%, the lowest on the Jersey Shore
- Stone Harbor: 0.413%
- Surf City: 0.650% · Long Beach Township: 0.665% · Ship Bottom: 0.702% · Beach Haven: 0.765%
- Bradley Beach: 0.915% · Belmar: 0.955%
- Neptune Township (Ocean Grove): 1.866%
Neptune’s effective rate is more than five times Avalon’s -- on a $1M property, roughly $15,000 a year in carrying cost before you’ve rented a single night. It never shows up in an ADR comparison, but it will quietly decide whether a deal clears.
Layer on the occupancy tax stack: 11.625% at the state level on OTA bookings, plus municipal taxes -- Bradley Beach, Stone Harbor and Cape May Point all adopted 3% in 2026, following Ocean City and Beach Haven, while Belmar, Surf City, Long Beach Township and Avalon sit at 0%.
We’re also not counting the varying costs of summer and winter certificates of occupancy, or the different administrative processes some municipalities require.
Same coastline. Materially different economics.
The return a top-ten list can’t see
A cap-rate ranking measures rent against purchase price and stops. A rental property pays you four ways: cash flow, appreciation, loan paydown, and tax benefits. IRR -- the annualized return on your cash counting all four -- is the number I actually use to determine pass or go.
Appreciation first. Core Shore towns are up 100% to 139% over ten years (Zillow: Belmar +103%, Bradley Beach +106%, Ocean Grove +116%, Cape May +139%), and New Jersey ranked first among all states for annual price growth in early 2026. Barrier-island coastline, two hours from thirty-plus million people, no new land coming.
The tax line does the quiet heavy lifting: a cost segregation study plus 100% bonus depreciation can front-load a major deduction into year one -- in service by December 31 for the 2026 return. That timeline gets its own article. Put honestly, at today’s rates a good Shore deal sits near breakeven on cash in year one; the return comes from cost seg, principal paydown, and appreciation. The deals that clear my screen pencil to low-double-digit after-tax annualized returns on a seven-year hold. Plenty don’t clear. That’s what the screen is for.
And two lines no spreadsheet captures. Personal use: your family actually stands in this asset, and the compressed season means an off-season week costs you almost nothing in revenue. And familiarity: you’ve been coming here since you were a kid -- you know which blocks flood and which towns fill up in June. That’s underwriting data no out-of-state buyer has. At the end of the hold you own a beach house your family uses, an asset that means something to you instead of something that showed up on a top-ten list one year.
Where I’d actually look
Not everywhere, and not at the top of the market. I think in counties, and each rewards a different buyer.
Monmouth County runs the strongest year-round season on the Shore -- it’s the closest coast to New York, and in my portfolio the calendar doesn’t die after Labor Day. Ocean Grove is the standout: price points that still work, and a tax benefit most investors miss entirely. Yes, that’s the same Neptune Township I just flagged for the Shore’s highest tax rate -- which is exactly why almost nobody looks closer. That one’s worth a call; feel free to message me. Belmar and Bradley Beach are where the operator gap is widest; entry runs $800K–$1.3M, and Belmar has an effectively open large-home slot -- only four or five 6BR+ listings town-wide on each platform. The catch: prices are rising. These towns reward buyers ready to move when the right property shows up, not buyers who need six months to think.
Ocean County is two markets wearing one name. Seaside and Lavallette can both work as entry points. Long Beach Island is the one I get asked about most, and it earns it -- the vibe is real and so is the revenue. Long Beach Township has the healthiest supply-demand balance I measured -- flat supply while rates and revenue climbed -- plus a 0.665% tax rate, no municipal occupancy tax, no minimum-stay ordinance. But LBI price points speak more to buyers underwriting appreciation than cash flow. Where I’d be careful: Beach Haven (supply +23.0%, revenue −18.6%) and Ship Bottom (+7.0% supply against −7.1% revenue), where new inventory is visibly outrunning demand.
Cape May County is where the value pocket hides. Everyone knows Avalon and Stone Harbor. Almost nobody prices the bayshore -- North Cape May up to the Villas is where I’ve been putting my own attention, with entry prices the island towns can’t touch and the ferry at the end of the road.
Each of these deserves more than a paragraph -- I’ll break them out one by one over the coming weeks. Same rules: real numbers, sources named, catches included.
The honest catch
Three of them, actually.
The season is short and not getting longer. Plan a revenue management strategy for the winter. If the deal only works at peak-summer rates, it doesn’t work or cash flow is not a priority.
Regulations are municipal, not statewide. New Jersey has no state STR law; every town writes its own, and the differences are severe -- Bradley Beach requires a 6.5-day minimum stay while Surf City, Long Beach Township, Avalon and Stone Harbor require none at all. Buying the wrong side of a town line is the most expensive mistake available here. I’ve written it up town by town separately.
The data is thinner than in mature STR markets. Sources disagree by 3-4x on something as basic as listing count -- you saw the asterisks above. I am always assessing data quality on every town I underwrite rather than pretending the numbers are cleaner than they are.
The bottom line
The Jersey Shore is not a market you buy for headline occupancy. It’s a market where the average listing is under-operated, the pro-managed spread runs as high as twenty-three points, the tax rates vary by five times across a single coastline, and the buyer pool has mostly been told to look somewhere warmer.
That combination doesn’t reward buying anything. It rewards buying the right town, finding the right property and running it like a business.
If you’re a Northeast investor who’s been flying to your rentals, that’s worth two hours in the car to look at.
If you want the town-by-town data behind any of this, feel free to message me. And if you’re getting serious about the Shore, the Jersey Shore Buyer Guide is a good place to start.
Cody Zucker is a Jersey Shore native, CPA, and Realtor® with Savvy STR Agents, brokered by eXp Realty. He also owns and operates a short-term rental management company on the Jersey Shore, which means the properties in this article aren’t theoretical to him. Work with Cody →
Nothing here is tax or investment advice. Run your own numbers with your own CPA.

Written by Cody Zucker
Cody Zucker is a Jersey Shore native and CPA with a background in financial services, asset management and Fortune 100 companies, experience he now applies to short-term rental investing across the Jersey Shore. Cody owns and manages a growing portfolio of short-term rental properties throughout Monmouth County, with deep roots just south in Ocean County, where he grew up and still knows the market cold. His experience extends well beyond the Shore: Cody has invested and operated STR properties in markets across the country, giving him a comparative lens on what actually drives performance from one market to the next. He brings a numbers-first, systems-driven approach to every deal, shaped by his finance background and sharpened by years of hands-on ownership and operations. Whether you're buying your first vacation rental or scaling an existing portfolio, Cody combines deep financial expertise with real operating experience to help you make confident, well-underwritten investment decisions. When he's not working on short-term rentals, you'll find Cody spending time with his family, staying active, or strolling the boardwalk back home at the Shore.
View Profile